Narmada College of Management, Bharuch
Workshop on
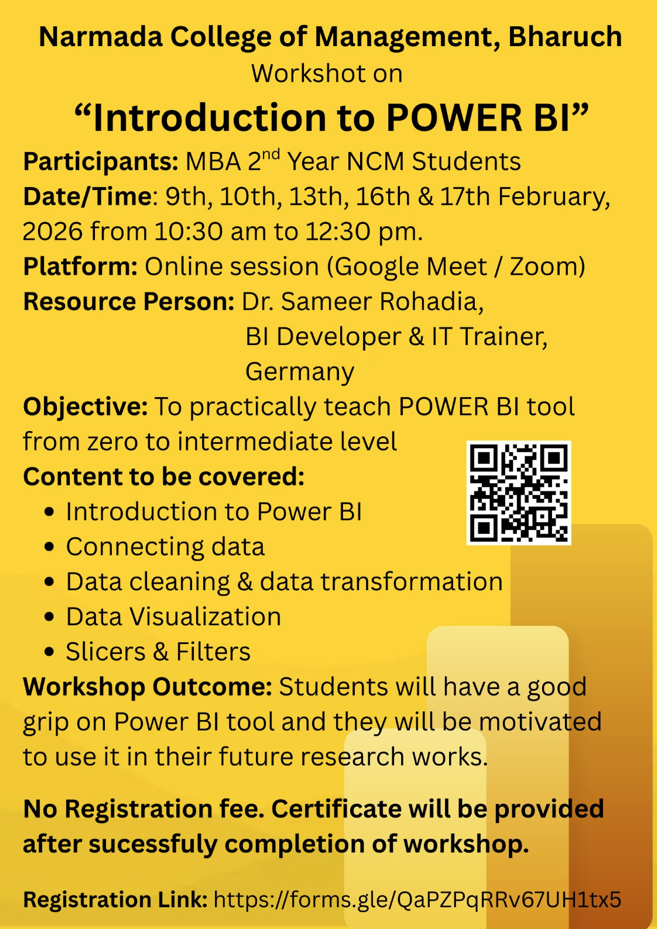
“Introduction to POWER BI”
Organised for: MBA 2nd Year NCM Students
Mode: Online (Google Meet / Zoom)
Duration: 5 Days | Total 10 Hours (2 Hours per Day)
Dates & Time: 9th, 10th, 13th, 16th & 17th February 2026
Time: 10:30 AM to 12:30 PM
Introduction
In today’s data-driven business environment, the ability to analyze, visualize, and interpret data is a critical skill for management students. Microsoft Power BI is one of the most widely used Business Intelligence tools across industries for creating interactive dashboards and insightful reports. This workshop is designed to introduce students to Power BI from scratch and guide them towards an intermediate level of practical proficiency.
Resource Person Profile
Dr. Sameer Rohadia
BI Developer & IT Trainer, Germany
Dr. Sameer Rohadia is an accomplished academician and industry professional with extensive experience in Business Intelligence, Data Analytics, and IT Management.
Academic & Professional Highlights:
- B.E. (Electrical Engineering) and MBA (IT) from Maharaja Sayajirao University of Baroda
• PhD in IT Management from Gujarat Technological University
• Master in Data Science from University of Bologna, Italy
• 15 years of experience as an MBA Professor and 10 years of industry experience
• Conducted 220+ webinars and workshops
• Trained 22,000+ professionals, faculty members, and students globally
• Conducted 60+ international sessions for German, Polish, and Slovenian students
• Recipient of 5 Teaching Excellence Awards
Workshop Objectives
The primary objective of this workshop is to provide hands-on training on the Microsoft Power BI tool, enabling participants to:
• Understand the fundamentals of Business Intelligence
• Connect Power BI with various data sources
• Clean and transform raw data into usable formats
• Create meaningful visualizations and dashboards
• Apply filters and slicers for interactive reporting
Workshop Structure & Content
Day-wise Coverage:
Day 1: Introduction to Business Intelligence and Power BI ecosystem
Day 2: Connecting data from Excel and other sources
Day 3: Data cleaning and transformation using Power Query
Day 4: Data visualization – charts, tables, and dashboards
Day 5: Slicers, filters, and best practices for reports
Expected Learning Outcomes
By the end of the workshop, participants will:
• Gain a strong foundation in Power BI
• Be able to independently create basic to intermediate dashboards
• Understand how Power BI can be applied in academic research and business analysis
• Be motivated to use analytics tools in future projects and research work
Certification & Registration
- No registration fee
• E-certificate will be provided after successful completion of the workshop
• Registration Link: https://forms.gle/QaPZPqRRv67UH1tx5
Coordinators
-
- Dr. Chetna Makwana, I/c Director
- Mr. Kanu Raval, System Analyst